
Configuring splunk
Prerequisites
Before you configure the Delphix Engine you will need to configure and make a note of the following in Splunk:
Please refer to the Splunk documentation for detailed steps on how to configure your values.
Supported Splunk versions
Delphix only supports Splunk Enterprise 6.3.0 or higher.
In the Splunk web UI Enable SSL (this is optional but best practice for security) in your global HTTP Event Collector (HEC) settings.
The Splunk hostname or IP Address.
The HEC Port number for your Splunk instance (default 8088).
Enable the HTTP Event Collector on Splunk, and create a new HEC Token with a new Splunk index set as an allowed index for the token. Make sure Enable Indexer Acknowledgement is unchecked for the token. Warning : If you wish, you can use a separate Splunk index for performance and capacity metrics (otherwise, the same index will be used for both events and metrics). If you are using Splunk 7.0+, it is recommended that you create this second index as a special “Metrics” type index that is optimized for indexing and searching metrics data.
Note the HEC Token Value and the Allowed Indexes for the token.
The following table provides an example of the data you will need.
Attribute | Sample data |
Splunk Server IP address | 192.168.8.8 |
Splunk Server HEC Port Number | 8088 |
Splunk HEC Token | 12345678-1234-1234-1234-1234567890AB |
Index Name for Events | delphix_events |
Index Name for Metrics | delphix_metrics |
Configuring Delphix for Splunk
Log in to the Delphix Server Setup UI as the sysadmin.
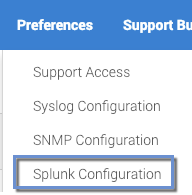
From the Preferences menu select Fluentd Configuration.
In the Fluentd Configuration window, enter your Splunk values, using the default splunkHec plugin configuration.
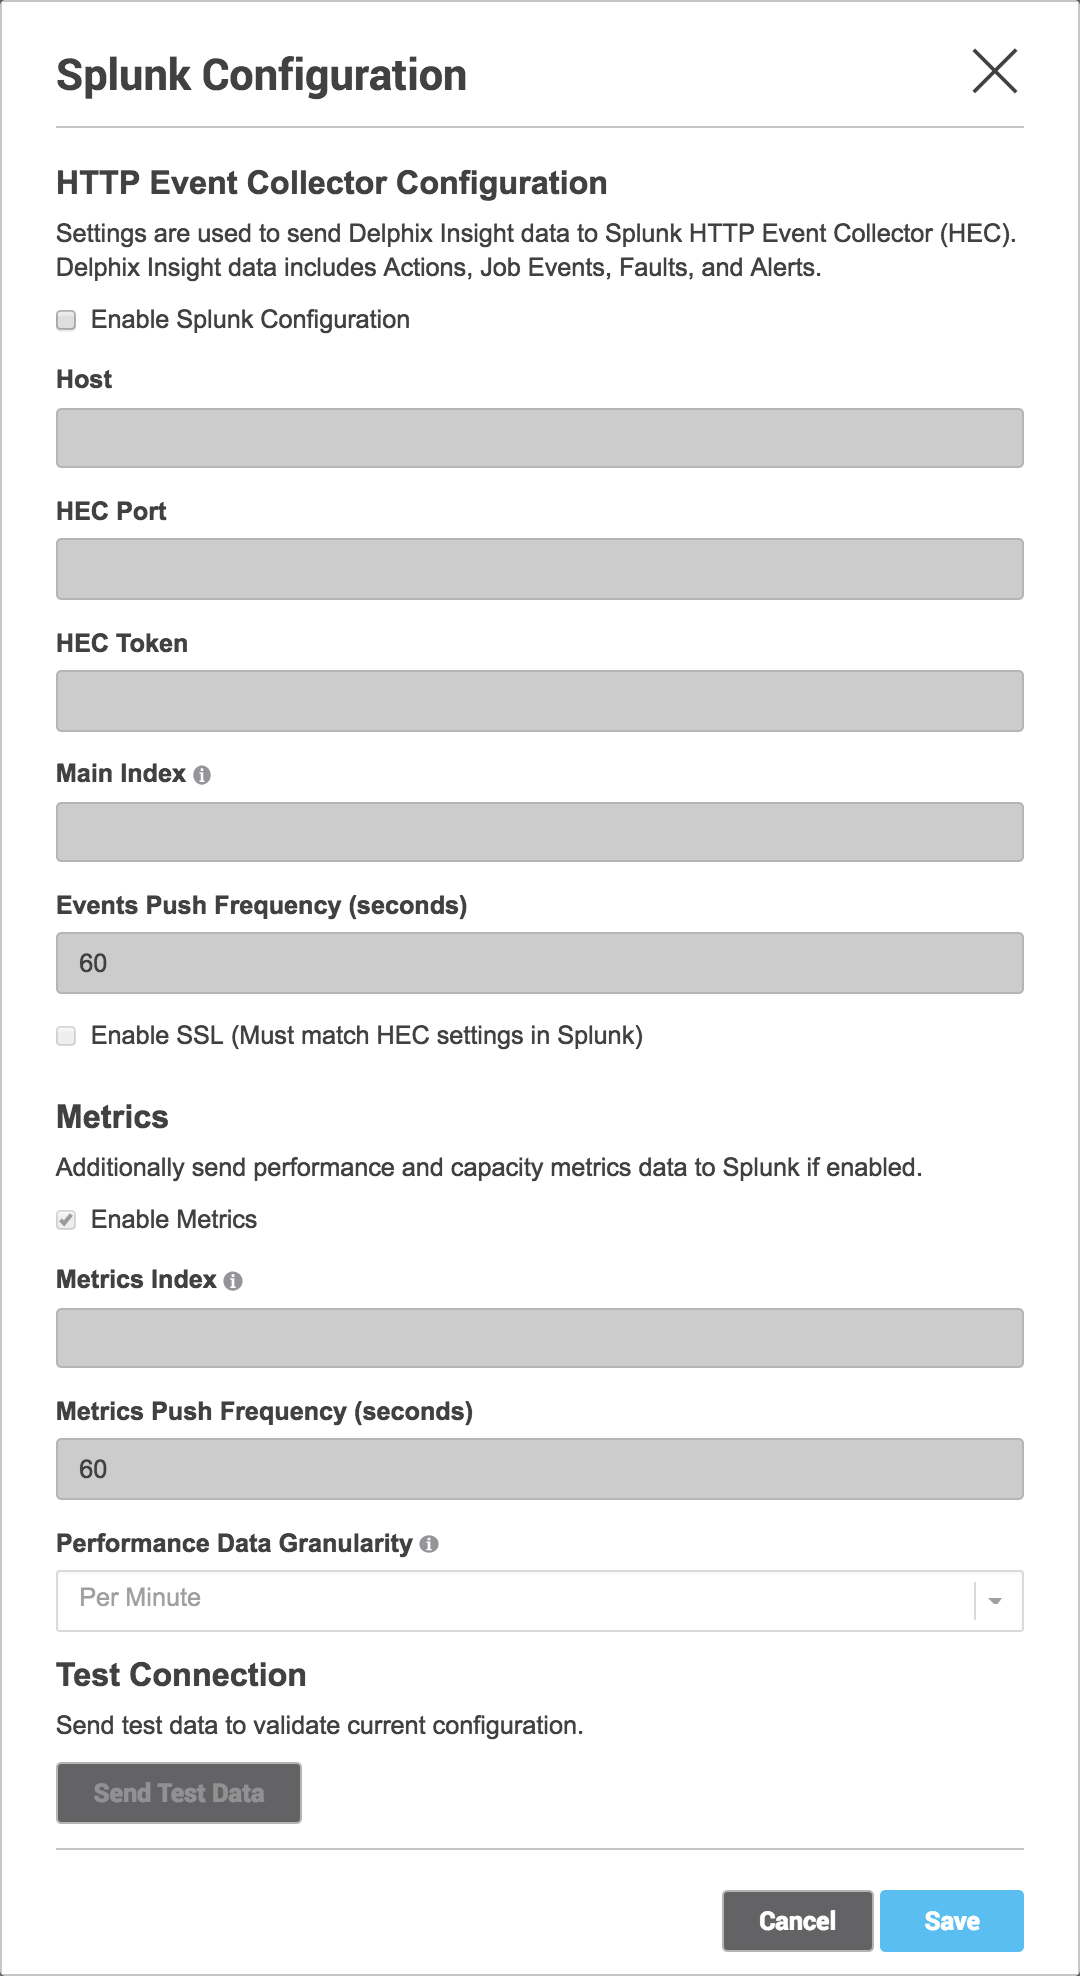
Host | Splunk hostname or IP address |
|---|---|
HEC Port | The TCP port number for the Splunk HTTP Event Collector (HEC) |
HEC Token | The token for the Splunk HTTP Event Collector (HEC) |
Main Index | The Splunk Index events will be sent to. It must be set as an allowed index for the HEC token. |
Events Push Frequency | The frequency at which the Events will be pushed to Splunk. Specified in seconds. |
Enable SSL | Whether to use HTTPS to connect to Splunk. Must match your HTTP Event Collector settings in Splunk. |
Metrics Index | The Splunk Index metrics will be sent to. If none is specified then the Main Index will be used for metrics as well. It must be set as an allowed index for the HEC token. |
Metrics Push Frequency | The frequency at which the Performance Metrics will be pushed to Splunk. Specified in seconds |
Performance Data Granularity | The resolution of performance metrics data sent to Splunk. |
Reducing the volume of data
To reduce the volume of data that will be sent to Splunk, you can change the Performance Data Granularity to Per Minute or uncheck Enable Metrics.
4. Click Send Test Data to verify your provided values. This will send a test event to the provided token and indexes.
5. Click Save to enable the Splunk configuration and begin sending all new Actions, Job Events, Faults, Alerts, and Metrics to your Splunk instance.