
Overview
The Faults screen provides information on states and configurations that may negatively impact the functionality of the Delphix Engine and which can only be resolved through active user intervention. When you login to the Delphix management application as admin, the number of outstanding system faults appears on the right-hand side of the navigation bar at the top of the screen. Faults serve as a record of all issues impacting the Delphix Engine and can never be deleted. However, ignored and resolved faults are not displayed in the faults list.
The Faults screen as shown below has two tabs, Current and Archive.
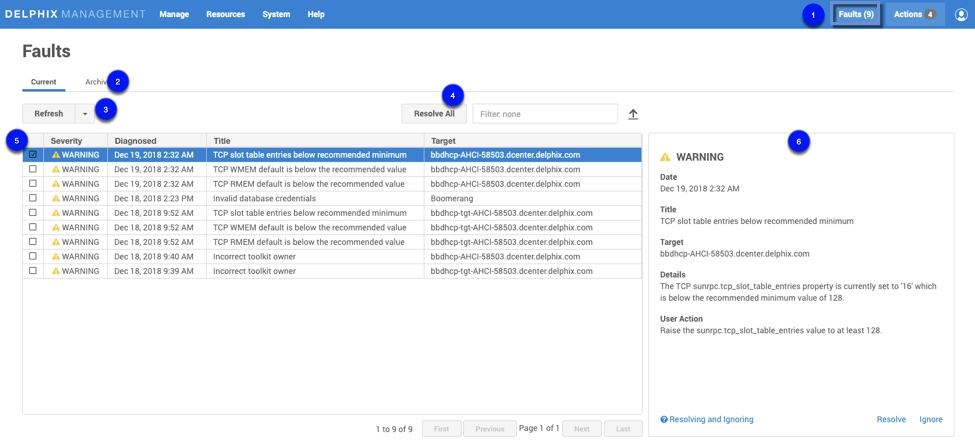
System Faults screen
-
The number of system faults.
2. The Faults screen has two tabs, Current and Archive. Details of the selected fault are displayed on a card located to the right of the fault list. In the Archive tab, you can switch between Resolved or Ignored faults and reset all ignored faults.
3. Selecting Refresh (Manual), will refresh the faults table manually, or you can select one of the other available options from the drop-down menu, available options include; Manual, 1 Second, 1 Minute, 5 Minutes.
(Note: as there is no longer a Refresh button on the screen, you must select Refresh (Manual) to refresh the screen.
4. To search the Faults table, enter the name of the object you are looking for. The grid will refresh to display the selected object. You can also sort using the column headings.
Resolve All will resolve all the faults in your system.
Select to expand or close the objects in the grid.
Select to export the information provided in the grid to a.csv file.
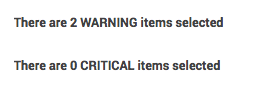
5. You can select and resolve multiple faults; the card panel will display how many of each type are selected. For example:
6. Details for the selected fault are displayed on a card. You can resolve or ignore faults by selecting the appropriate link at the bottom of the card.
Resolving and Ignoring Faults
Ignoring a fault will also ignore future faults of that exact type against the same object, so that future fault conditions will not be re-diagnosed even if the fault condition persists or recurs. No further notifications will be received for that specific fault condition. It is advisable to only ignore faults when the following criteria are met:
-
The fault is caused by a well-understood issue that cannot be changed.
-
Its impact on the Delphix Engine is well understood and does not require action.
For example, if you think that knowing about this error in the future will be important, use "Resolve" rather than "Ignore". If you reset ignored items, this clears all ignored faults, but it leaves them as resolved and does not restore the actual fault. For reset ignored faults, new faults against the same object will no longer be ignored and you will again receive notifications. Examples: If you ignore a fault "Unable to ping host" for target "192.168.1.1", Delphix ignores "Unable to ping host" errors against target 192.168.1.1. You will never see the "Unable to ping host" fault again for that target 192.168.1.1 unless you reset ignored items. Similarly, some faults are raised against snapshots which are part of a dSource. Ignoring those errors only ignores similar errors for that exact snapshot. Tomorrow's snapshot could produce the fault again.
Delphix object-based environment monitor faults
Delphix now has a self-contained Java-based discovery infrastructure that consolidates with environmental monitoring, communicates via a common framework, and is able to provide feedback.
The environment monitor previously only created faults for "hosts" and "sources." There are several faults that more logically apply to other Delphix objects, such as repositories, which are DB install files. Posting them against sources results in fault duplication. The environment monitor now posts faults against -- and re-associates the offending faults with -- the correct objects. Consequently, users see fewer errors that are easier to diagnose.
Viewing faults
To view the list of active system faults:
-
In the top navigation bar, click System then Faults.
-
In the Faults screen, click any fault in the list to expand it and see its details.
The details for the selected Fault will be displayed in the details card located on the right.
Each fault comprises six parts:
-
Severity – How much of an impact the fault will have on the system. A fault can have a severity of either Warning or Critical.
-
A Warning Fault implies that the system can continue despite the fault but may not perform optimally in all scenarios.
-
A Critical Fault describes an issue that breaks certain functionality and must be resolved before some or all functions of the Delphix Engine can be performed.
-
-
Date – The date that the Delphix Engine diagnosed the fault.
-
Title – A short descriptive summary of the fault
-
Target – The object against which the fault was posted. Faults will be posted against the host for incorrect environment configurations, sources for problems with the database, and repositories for issues with the installation.
-
Details – A detailed summary of the cause of the fault
-
User action – The action you can take to resolve the fault
Addressing faults
After viewing a fault and deciding on the appropriate course of action, you can address the fault through the user interface (UI). You can mark a fault as Ignored or Resolved. If you have fixed the underlying cause of the fault, mark it as Resolved. Note that if the fault condition persists, it will be detected in the future and re-diagnosed. You can mark the fault as Ignored if it meets the following criteria:
-
The fault is caused by a well-understood issue that cannot be changed
-
Its impact on the Delphix Engine is well understood and acceptable
In this case, the fault will not be re-diagnosed even if the fault condition persists. You will receive no further notifications.
To address a fault follow the steps below.
-
In the top menu bar, click Faults.
-
In the list of faults, click a fault date/name to view the fault details.
-
If the fault condition has been resolved, click Resolve.
Note that if the fault condition persists it will be detected in the future and re-diagnosed. -
If the fault condition describes a configuration with a well-understood impact on the Delphix Engine that cannot be changed, you can ignore the fault by clicking Ignore.
Note that an ignored fault will not be diagnosed again even if the underlying condition persists.
By default, when a critical or warning fault occurs, the Delphix Engine immediately sends an email to the Engine Administrator (admin). Make sure you have configured an SMTP server and defined an appropriate email address for Engine Administrator (admin). See Initial Setup for more information.
Critical or warning alert emails
By default, emails will also be sent for critical or warning alerts (aka events). You can modify the default behavior by changing the alert profile with the CLI. See the CLI Cookbook Creating Alert Profiles for more information.
Fault lifecycle example
Below is an image of the fault card for the fault "TCP slot table entries below the recommended minimum."
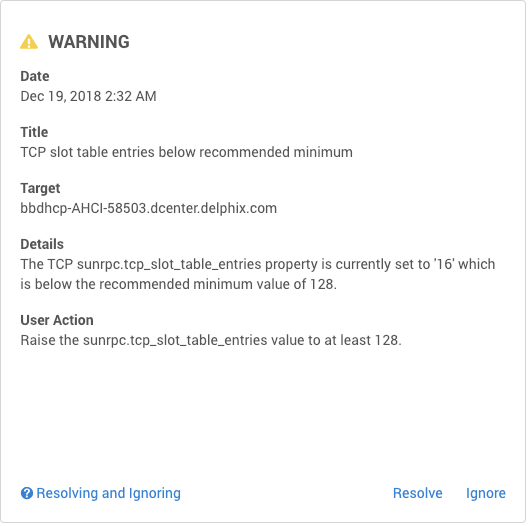
The Details section of the fault explains that the sunrpc.tcp_slot_table_entries property is set to a value that is below the recommended minimum of 128. The User action section instructs you to adjust the value of the sunrpc.tcp_slot_table_entries property upward to the recommended minimum. The process for adjusting this property differs between operating systems. To resolve the underlying issue, search "how to adjust sunrpc.tcp_slot_table_entries" using a search engine and find that the second result is a link to the Delphix community forum describing how to resolve this issue. After following the instructions applicable to your operating system, return to the Delphix UI and mark the fault resolved.