Branch timeline
A branch timeline acts as a dynamic point-in-time interface for user actions within the branch. You can interact with the source data in the active branch by using both the branch timeline and icons along the Self-Service Toolbar at specific points in time. Common activities include re-setting data sources to run a test, refreshing the data container with the most current source data, and bookmarking data to share or track interesting moments of time along the branch timeline. Users work with one branch at a time to perform a series of actions related to a particular testing or debugging task such as data updates or starting and stopping data. The initial branch on your data container may include data from before the data sources were made into a container. As you work within your data container, you can create more branches overtime to run or complete separate tasks. Additionally, the data container tracks each branch and the corresponding actions you perform on the branches. To view the actions completed over the life of a branch, see the container timeline in the Time tab of the Data Container View Panel.
Container Timeline
The Time tab displays the data container's timeline, which acts as a wall clock of time. It shows continuous real-time across all branches and timeline segments. You can scroll up and down in the container timeline to find the point in time that interests you.
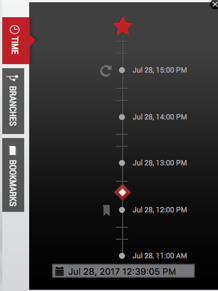
Clicking a point in time in the container timeline will display the corresponding branch timeline capturing any actions performed on the branch. Additionally, should you need to select a time between tick-marks, you can use the time input field in the time selector on the left side of the screen.
Selecting a Point in Time with the Time Selector
-
In the time selector, type in a date and time with the following format:
Month/Day/Year Hour:Minute:Second{am|pm}. For example: 1/26/2015 1:14:13pm. -
Press Enter.
The time input field will show the selected time. Now that you have entered the specific time you want, you can use the toolbar to select the data operation that you want to be performed at this point in time. Data operations can include Create Bookmark, Create Branch, and Restore.
Invalid Time Value
If you type in an invalid time value, or a time that is out of range, the value you typed in will revert to the previous default that existed before.
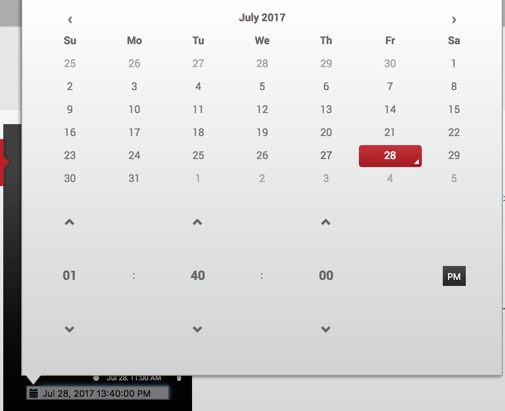
Selecting a Point in Time with the Time Selector Calendar
-
In the time selector, click the calendar icon to the left of the input field.
-
From the window that appears, click the date you want to use.
-
Select and time you want to use.
-
In the toolbar, click the button for the data operation that you want to perform at this point in time. Data operations can include Reset, Create Branch, and Create a Bookmark.
Picking a date
The flyout will not let you pick a date that is before the first point of data time in the container, or after the present moment.
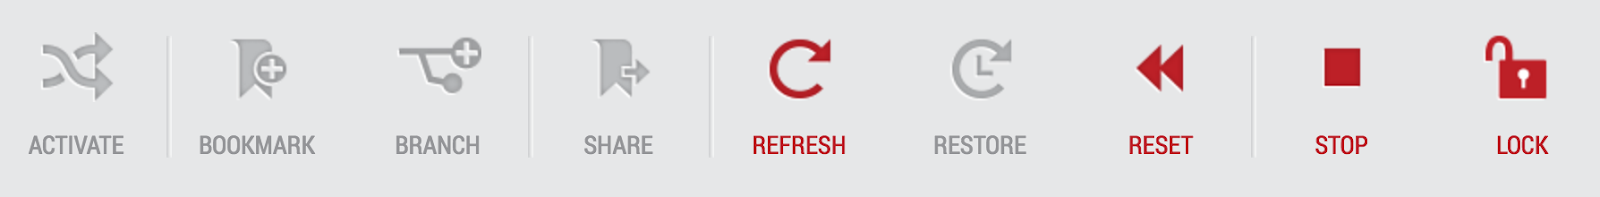
Understanding the self-service toolbar
The Self-Service Toolbar contains self-service action icons that represent available actions a data user can perform. You can distinguish between available and unavailable icon actions by the use of color on the toolbar. Actions available to you will be red, and actions that are unavailable will be grey. All actions are dynamic, and availability will change based on how you use and work with data in both the branches and data container(s) that are assigned to you.
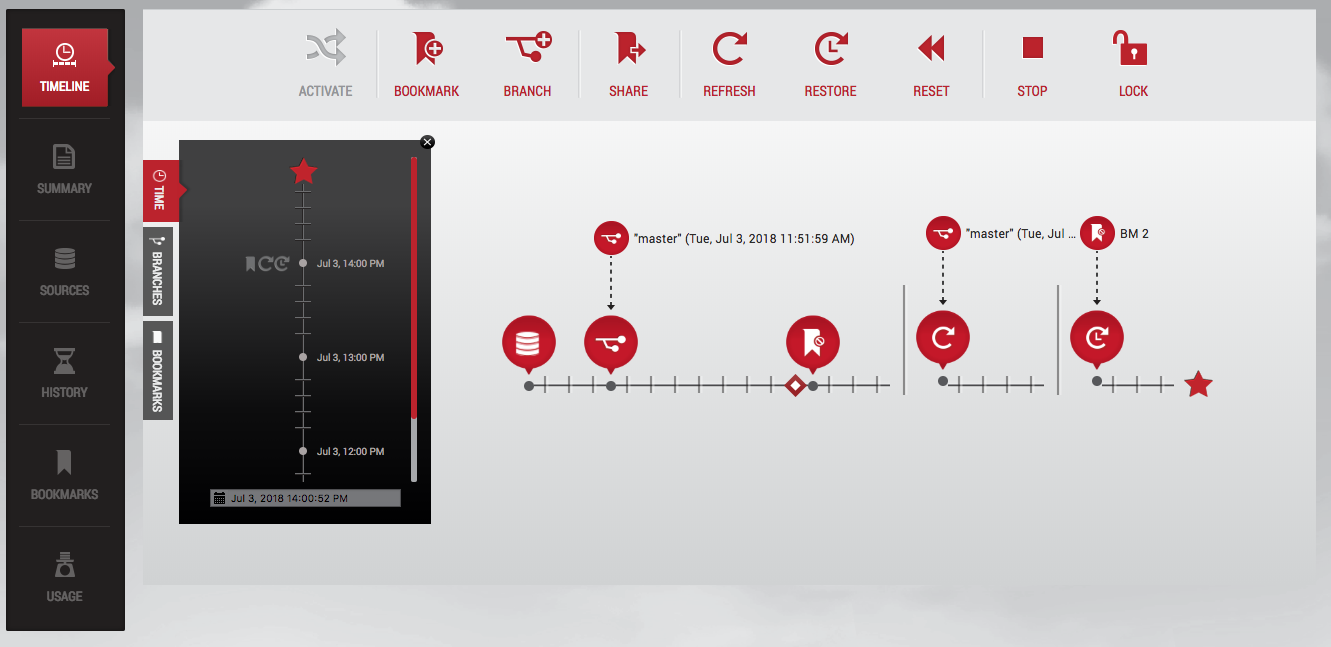
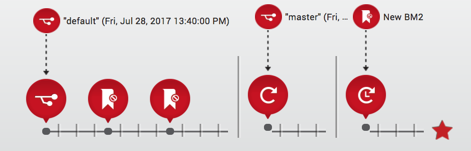
For example, your options for actions on the Self-Service Toolbar can change if the branch of the branch timeline you are working with is activated. In the illustration below, the screen shows a user working in an active branch. Notice the bright red star at the end of the timeline. This indicates that the branch is active. Also, notice which actions are and are not available to the user on the Self-Service Toolbar.
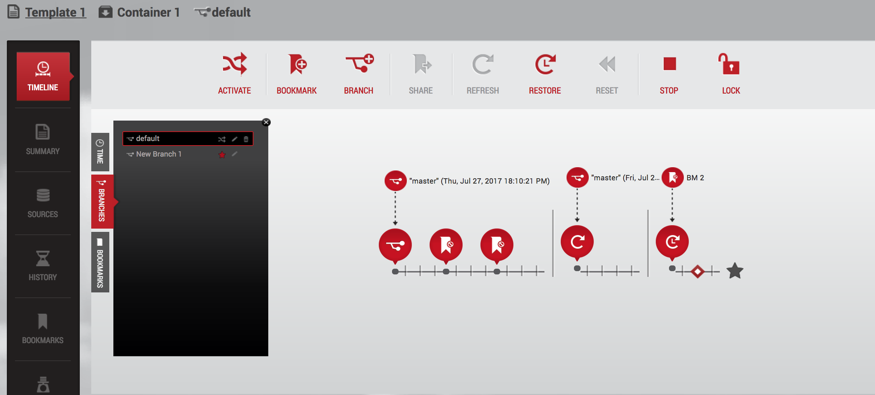
The Self-Service Toolbar is dynamic and will change based on tasks a user performs in Self-Service. These workflows will influence how and when self-service actions become available on the Self-Service Toolbar.
Branch timeline segments
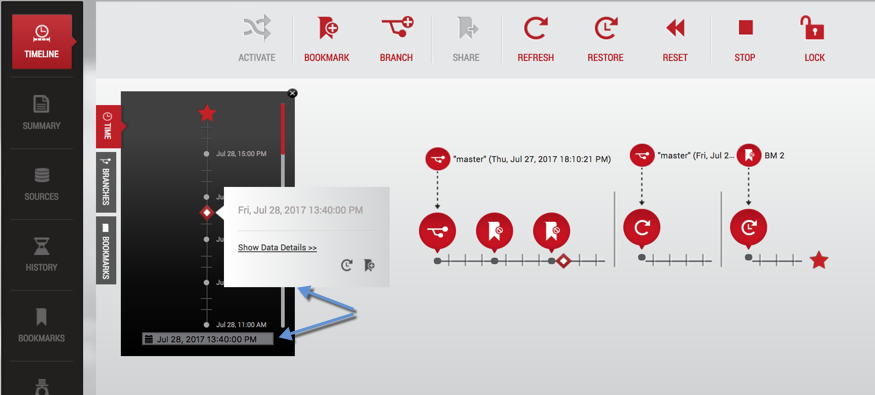
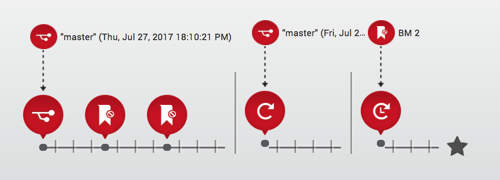
A branch timeline with segments is a visual representation of actions taken on a branch timeline over a time span. The timeline segments represents data in time that is no longer contiguous once a user clicks Create Branch, Refresh, Reset, or Restore on the Self-Service Toolbar. A vertical bar between each of the segments appears to remind a Delphix Self-Service user that the data in one timeline segment is a completely new data start. In other words, while the data within one segment is logically contiguous, the data is never contiguous across segments. For example, the following image shows a timeline with multiple segments.
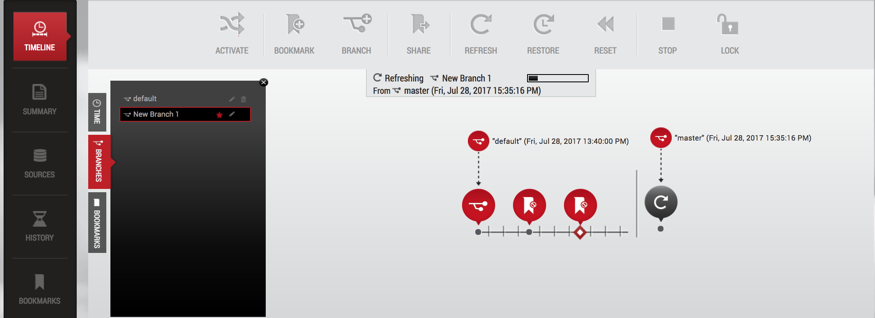
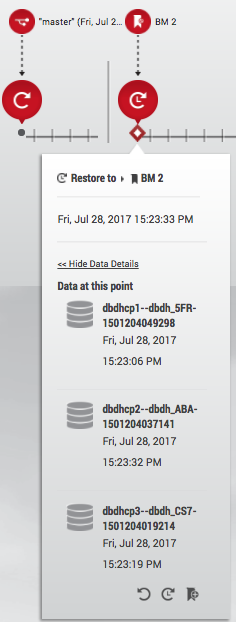
As mentioned above, the branch timeline becomes segmented after you have performed a specific action or task, such as Refresh. Based on the action, two red bubbles will appear in the time segment. The top bubble indicates where the data used for this action came from – for example, the data template, a different branch, or a shared bookmark. The second red bubble appears on the timeline as the actual data stream in a point in time from the parent data. It appears because of actions such as Refresh, Reset, Restore, Create Branch and Bookmark. Clicking the second bubble will show you specific details of the action, such as the specifics of the action including its name, the time the action occurred, and the data sources used at a point in time. This is illustrated below.
Working with multiple branches and timelines
As you work in your data container, you can switch between branches to work on resolving a bug or to test a new application feature.
For example, consider what occurs on two different branches in a container:
-
Branch one
Branch one timeline. -
Branch two
Branch two timeline.
A user may have actually worked with these branches in the following order over time:
-
Branch 1: Create a branch and use
-
Branch 2: Create another branch and use

-
Branch 1: Activate branch, Restore the data source and use
-
Branch 2: Activate branch and create bookmarks

-
Branch 2: Refresh the data source from a particular point in time

-
Branch 2: Reset a branch to the last action (e.g., refresh) on the timeline, and use

In the above illustrations, an individual branch's timeline shows all actions performed on the branch while the branch was active. The active branch timeline can be interrupted and deactivated when you choose to perform actions such as switching to another branch, Create Branch, Activate, or Stop a data container. Additionally, you will only be able to view actions on a single branch at a time. A better way to manage multiple branches is to go to the Time tab in the Data Container View Panel. The Time tab allows you to access the container timeline, which becomes useful as you toggle back and forth between branches to complete different tasks. The container timeline allows you to view all the continuous data points of time, with all actions taken on all branches in a single data container.

Merging keystores requires several manual steps. Refer to Migrating a TDE-enabled vPDB for more information.
Understanding how to preserve data in a point in time
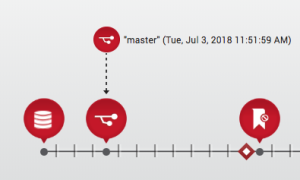
The following illustration shows that on 8/27/14, at 9:33:09am, data was reset to the parent data branch (master) at 9:28:48am, capturing data points from 9:33:06am.
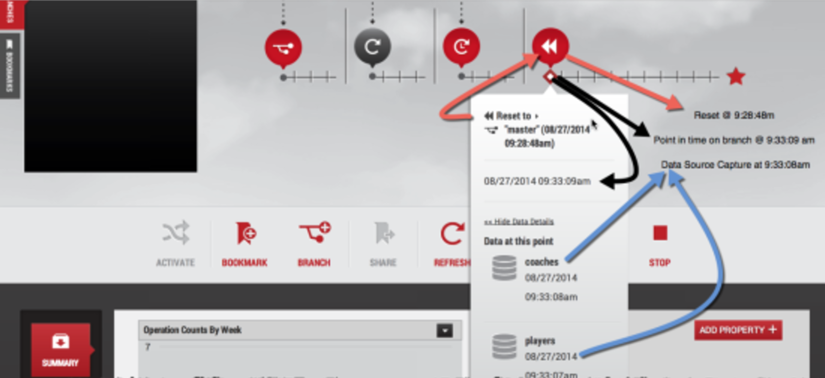
The black arrows above point to a tick, (representing a point in time) clicked on the branch timeline. This represents the time the Reset action was performed on the data container. The red arrows point to when time was captured in a data source using the Reset action on the branch timeline. When clicked, the reset bubble provides more details with a flyout, indicating where the data comes from and the time that the data represents. Additionally, the reset bubble detail flip card provides additional information about each data source. Specifically, the blue arrows point to the time used for each data source at this point in the data container.
This does not show the time that was used for each source that pulled the data.
The time represented on the branch timeline varies based on many factors. For example, after you select a specific point in time on the branch timeline, the Delphix Engine will map that point to the closest usable point in time for each data source. Based on the properties of the underlying data sources, these times may be different. Not all data sources track changes at the same granularity, as illustrated below.
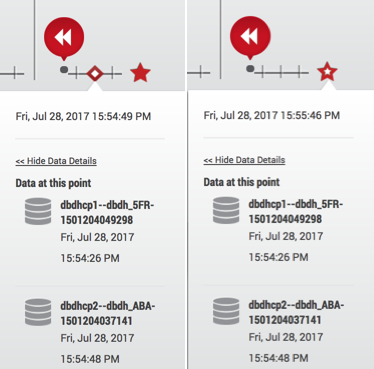
While a branch timeline can follow a continuous-time flow, the data sources being selected for each time segment may not be continuous.
Understanding bookmarks
Bookmarks are a way to mark and name a particular moment of data on a timeline that makes it easy to search and find events later. Once a point in time is selected, you can create a bookmark. You can select a specific point in time on the branch timeline, the Delphix Engine will then map that point to the closest usable point in time for each data source. Based on the properties of the underlying data sources, time may not be the same for every data source in the container. Not all data sources track changes at the same granularity. For more information, see Working with Bookmarks in a Data Container.
Note
A bookmark captures the latest point-in-time (not exceeding the bookmark timestamp) that is available while creating the bookmark. When you access the bookmark later, it does not get a closer time even if new logs are available.
Once created, you can easily locate a bookmark through one of the bookmark viewers in the interface.
Bookmarks tab in the data container view panel
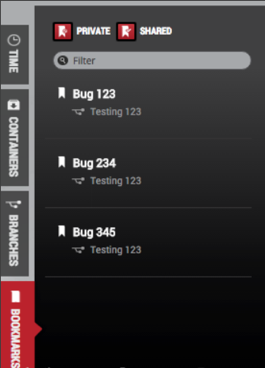
The Bookmarks tab is the third tab in the Data Container View Panel within the data container workspace of the Delphix Self-Service interface. It allows you to find a bookmark that is within your data container and view the branch where the bookmark has been placed.
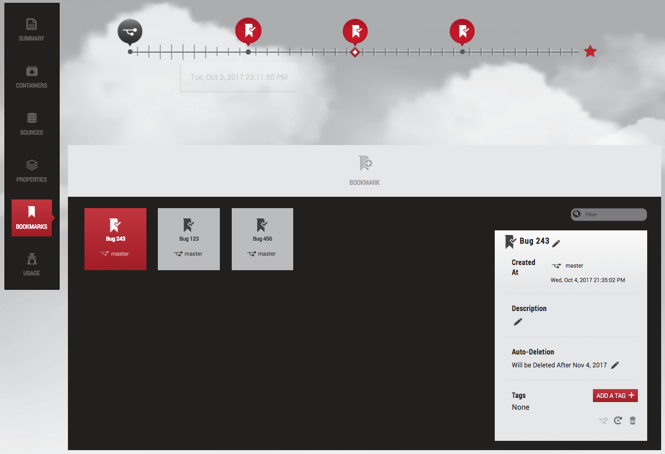
Bookmarks tile in the data container report Panel
The Bookmarks tile in the Data Container Report Panel allows you to see all bookmarks within your container and all bookmarks that other users have made available to you. Here you can also edit details about bookmarks, create new branches, and restore the active branch to the bookmark's point of data time.
Bookmark sharing permissions
When you first create them, bookmarks are private to your data container, but you can share a bookmark with other data users. Bookmarks that other users have shared with you are called "available" bookmarks.
Your bookmarks will only be shared with data users in data containers created from the same data template. This is because all data containers created from the same data template have a compatible set of data sources.
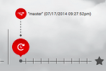
Bookmark appearance
|
|
A bookmark that is private. |
|
|
A bookmark you have shared. |
|
|
A bookmark that has been shared with you. |
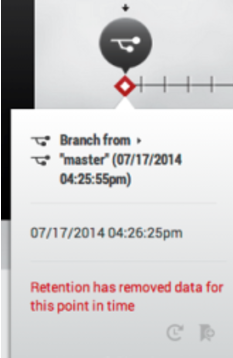
Data container storage and retention for branches and timelines
Bookmarks mark a moment of data. Delphix Self-Service will never automatically delete the data marked by a bookmark. However, Delphix Self-Service will automatically delete a bookmark with an expiration date set after it has expired. For more information on setting or removing an expiration date, see Data Container Activities. Delphix Self-Service may delete data from any time in the past on your branches, depending on the retention policies configured by your administrator. If you select a moment of data that has been deleted, the flyout will indicate that retention has removed data for this point in time.