
Diagnosing connectivity errors
Prior to the 5.1 release, when the Delphix Engine ran into an error operating on an external database or environment, it reported the immediate error that it had encountered; there was no mechanism for automatic analysis of the root causes of failures. The 5.1 release included infrastructure for automatic diagnosis of errors. When one of there errors occurs, the Delphix Engine now launches a set of tests to locate the root cause of the problem and present the result of the diagnosis. This will help you easily identify the true sources of errors such as closed ports or misconfigured router.
Failed actions
The Delphix Engine communicates failures in two different manners: actions that fail to complete, and faults. To view failed actions:
In the top right-hand corner of the Delphix Management application, click Actions.
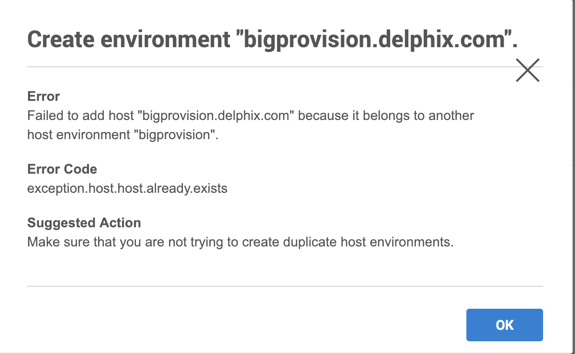
For more information about why the action failed, click the (ℹ) icon to show the error dialog.
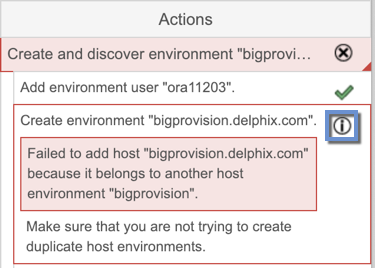
The following shows a popup message with more information about the problem and what actions to take to resolve it. For some errors, the Delphix Engine will be able to diagnose the problem further and display this extra information under Diagnosing Information. In the screenshot above, the job failed because the Delphix Engine was unable to lookup the host address.
Viewing active faults
A fault symbolizes a condition that can affect the performance or functionality of the Delphix Engine and must be addressed. Faults can be either warnings or critical failures that prevent the Delphix Engine from functioning normally. For example, a problem with a source or target environment can cause SnapSync or LogSync policy jobs to fail. Faults will show up as active as long as:
The error is still occurring, or
You have chosen to manually resolve it or ignore it
For example, if a background job fails, it will create a fault that describes the problem. To view any active faults:
In the top right-hand corner of the Delphix Management interface, click Faults.
This brings the Faults screen listing all active faults.
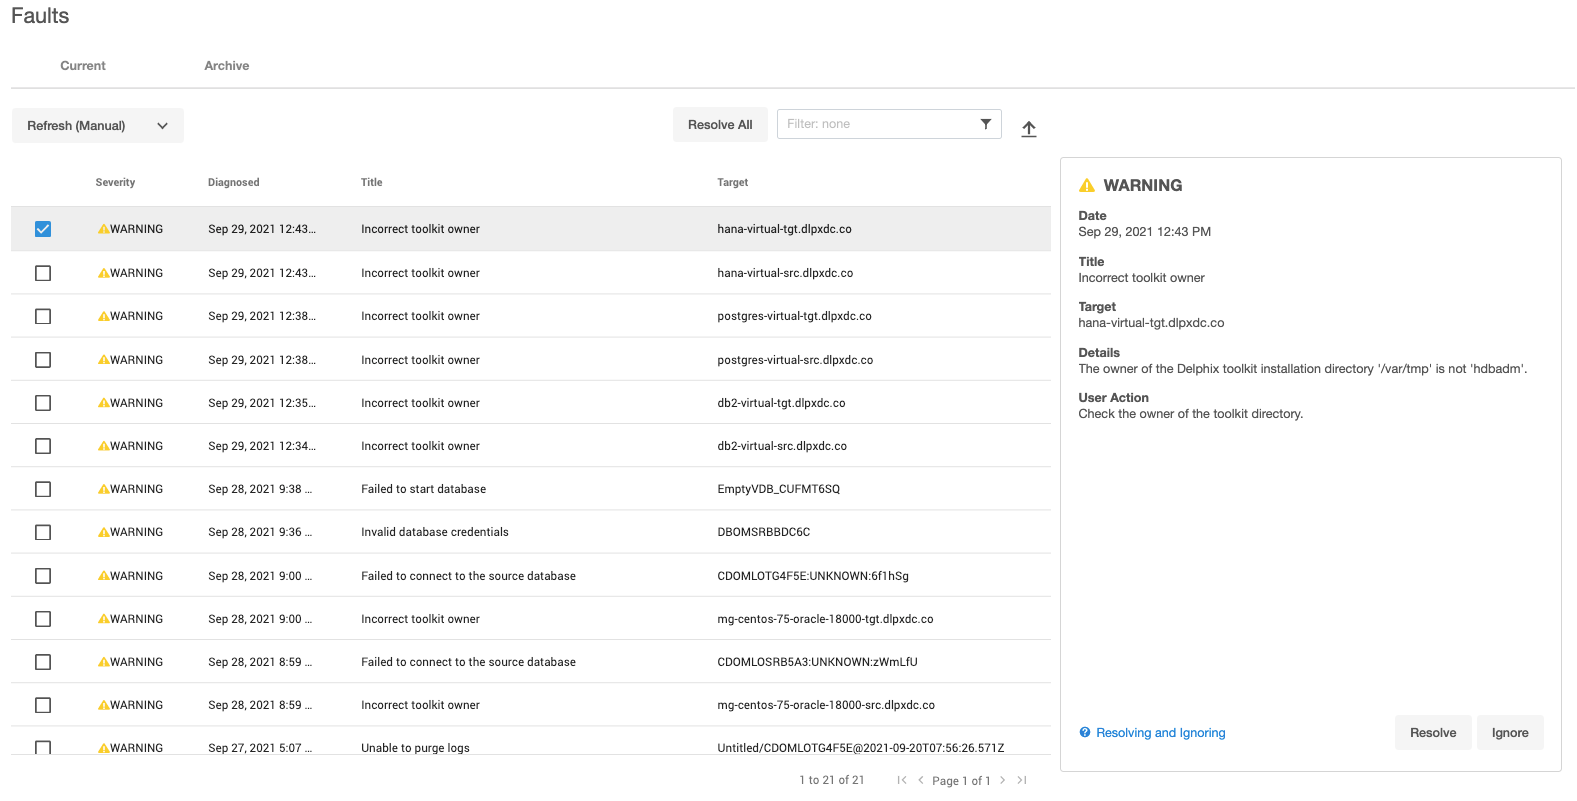
The screenshot above illustrates a fault with regard to a failure to a TCP slot table entry. The Delphix Engine will mark an object with a warning triangle to indicate that it is affected by an external problem. You can view more details of the fault by looking at the active faults and their fault effects.