
Use the search to analyze your data and enumerate items in a metrics index. For more about searching a metrics index, refer to the Splunk documentation.
Search examples - Metrics
The following examples provide information on viewing Metrics on Splunk 7.x
To get a list of all Metrics:
| mcatalog values(metric_name)
To get a list of all dimensions of a given metric - say CPU utilization percentage:
| mcatalog values(_dims) where metric_name="system.cpu.util.pct"
To view the average values of overall CPU utilization percentage across all hosts with a span of 30 seconds:
| mstats avg(_value) WHERE index=delphix_metrics AND metric_name=system.cpu.util.pct span=30s
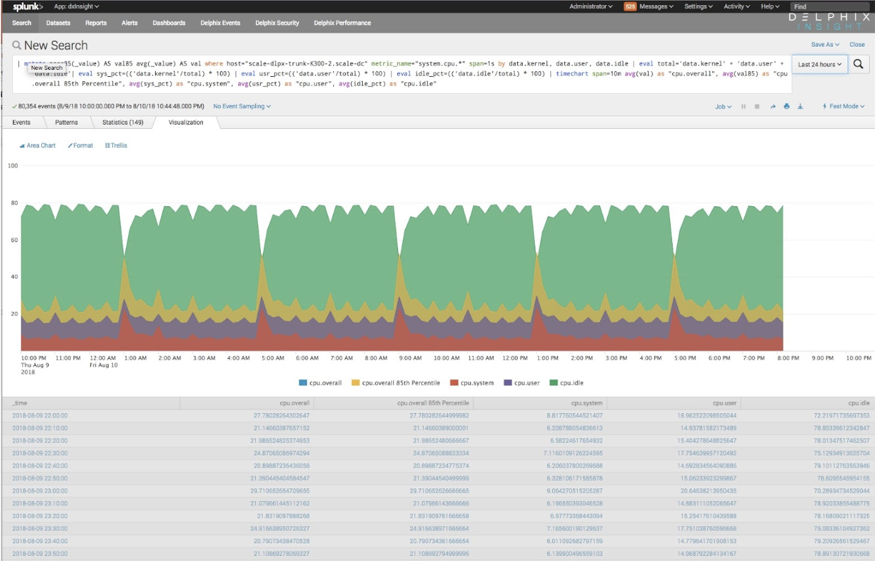
You can also display results in a chart with CPU wildcard:
| mstats perc85(_value) AS val85 avg(_value) AS val where metric_name="system.cpu.*" span=1s by data.kernel, data.user, data.idle
| eval total='data.kernel' + 'data.user' + 'data.idle'
| eval sys_pct=(('data.kernel'/total) * 100)
| eval usr_pct=(('data.user'/total) * 100)
| eval idle_pct=(('data.idle'/total) * 100)
| timechart span=10m avg(val) as "cpu.overall", avg(val85) as "cpu.overall 85th Percentile", avg(sys_pct) as "cpu.system", avg(usr_pct) as "cpu.user", avg(idle_pct) as "cpu.idle"
This type of search can be used to stack different CPU metrics that add up to 100%. Here is a sample screenshot of the above “stack different CPU metrics” from the Delphix Engines.
Search examples - events
The following queries demonstrate some basic visualizations of various Delphix events. The delphix _index value should be replaced with the name of the Main Index provided in during Delphix Setup. These examples serve as useful starting points that can be expanded to include other relevant data. See Events Format for a full description of the structure of each type of event.
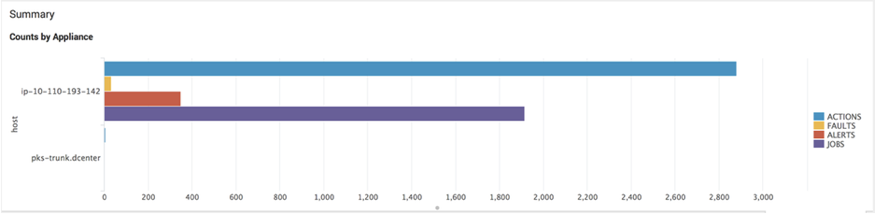
Display event statistics per host
Search
index="delphix_index" | stats
count(eval(source="delphix.events.action.completed" OR
source="delphix.events.action.started" OR
source="delphix.events.action.waiting" )) AS ACTIONS
count(eval(source="delphix.events.fault.posted")) AS FAULTS
count(eval(source="delphix.events.alert" )) AS ALERTS count(eval(source="delphix.events.job.event" )) AS JOBS BY host
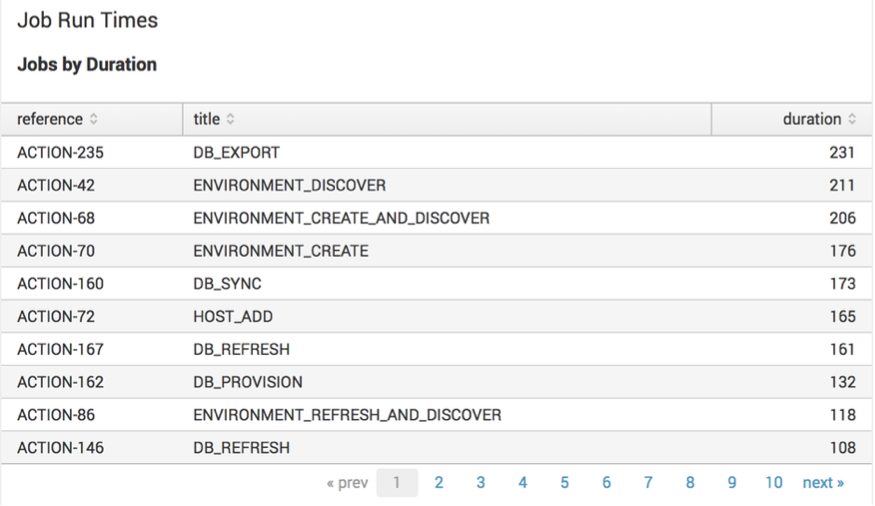
List actions in descending order by the duration
Search
index="delphix_index" source="delphix.events.action.*" | transaction reference | table reference title duration | sort duration
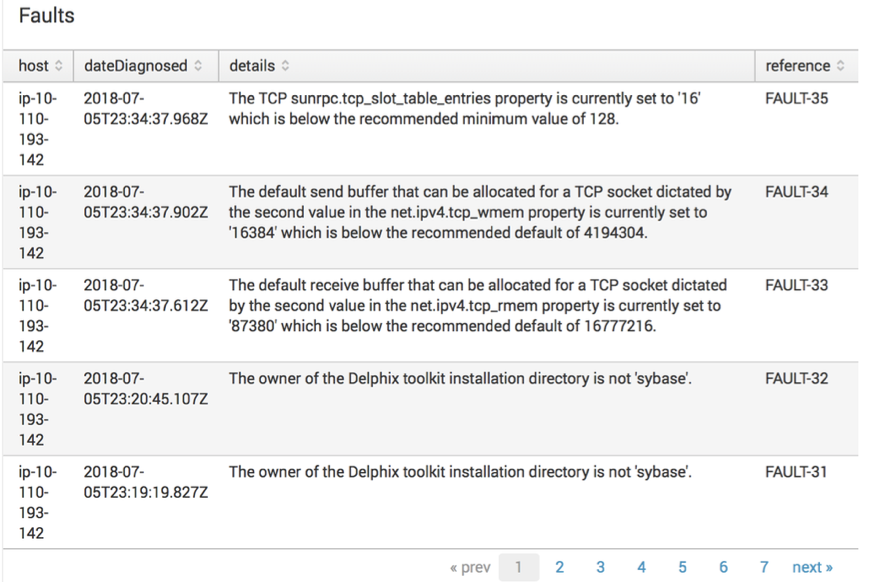
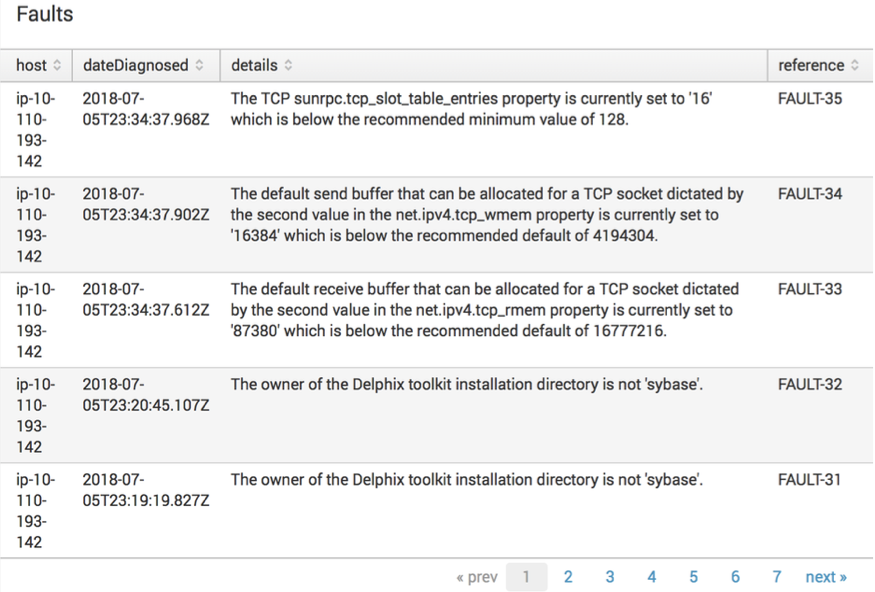
Lists faults
Search
index="delphix_index" source="delphix.events.fault.posted" | table host dateDiagnosed details reference
Completed jobs
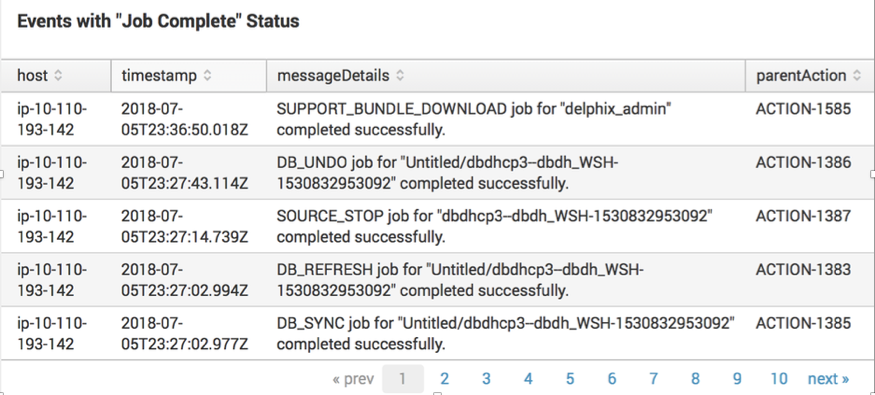
Search
index="delphix_index" source="delphix.events.job.event"| spath jobState | search jobState=COMPLETED | table host timestamp messageDetails parentAction
Lists faults
Search
index="delphix_index" source="delphix.events.fault.posted" | table host dateDiagnosed details reference
Completed jobs
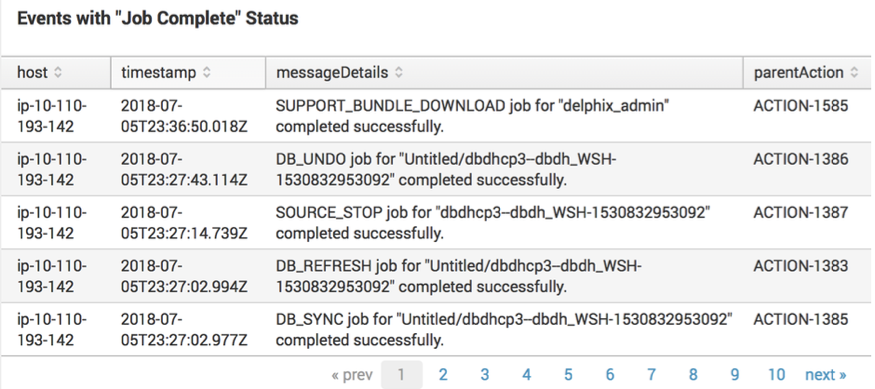
Search
index="delphix_index" source="delphix.events.job.event"| spath jobState | search jobState=COMPLETED | table host timestamp messageDetails parentAction
Search examples - event formats
The Actions, Job Events, Faults, and Alerts that Delphix sends to Splunk are structured according to predefined JSON schemas
JSON schemas for events
The following set of JSON schemas define the shape of each Splunk event, including which properties are expected to exist for each event type and what those properties mean. Some of these .json files are used as shared building blocks to define the other schemas; the top-level schemas which define each distinct event type are Action.json, Alert.json, JobEvent.json, Fault.json, and FaultEffect.json.
Below key-values are Splunk event metadata - This follows GeneralSplunkHeader.json - schema and GeneralSplunkEvent.json
GeneralSplunkHeader.json
{
    "$schema": "http://json-schema.org/draft-04/schema#",
    "type": "object",
    "properties": {
        "time": {
            "description": "The time the event was logged. The default time format is epoch time format, in the format <sec>.<ms>.",
            "type": "number"
        },
        "host": {
            "description": "The system's hostname. Will be the host value assigned to the event data in Splunk.",
            "type": "string"
        },
        "source": {
            "description": "For example mgmt.event.action. Will be the source value to assigned to the event data in Splunk.",
            "type": "string"
        },
        "sourcetype": {
            "description": "The sourcetype value to assign to the event data.",
            "type": "string"
        },
        "index": {
            "description": "The name of the index by which the event data is to be indexed.",
            "type": "string"
        }
    },
    "required": ["time", "host", "source", "sourcetype", "index"]
}
GeneralSplunkEvent.json
{
    "$schema": "http://json-schema.org/draft-04/schema#",
    "type": "object",
    "properties": {
        "systemUniqueId": {
            "description": "The UUID of the system.",
            "type": "string"
        },
        "systemVersion": {
            "description": "The release version of the system.",
            "type": "string"
        }
    },
    "required": ["systemUniqueId", "systemVersion"]
}
Action.json
{
    "$schema": "http://json-schema.org/draft-04/schema#",
    "definitions": {
        "ActionEvent": {
            "type": "object",
            "properties": {
                "reference": {
                    "description": "The object reference of the action.",
                    "type": "string"
                },
                "title": {
                    "description": "Action title.",
                    "type": "string"
                },
                "details": {
                    "description": "Plain text description of the action.",
                    "type": "string"
                },
                "startTime": {
                    "description": "The time the action occurred. For a long running process, this represents the starting time.",
                    "type": "string"
                },
                "endTime": {
                    "description": "The time the action completed.",
                    "type": "string"
                },
                "user": {
                    "description": "The user who initiated the action.",
                    "type": "string"
                },
                "userAgent": {
                    "description": "Name of the client software used to initiate the action.",
                    "type": "string"
                },
                "originIp": {
                    "description": "Network address used to initiate the action",
                    "type": "string"
                },
                "parentAction": {
                    "description": "The parent action of this action.",
                    "type": "string"
                },
                "state": {
                    "description": "State of the action",
                    "type": "string"
                },
                "workSource": {
                    "description": "Origin of the work that caused the action.",
                    "type": "string"
                },
                "workSourceName": {
                    "description": "Name of the user or policy that initiated the action.",
                    "type": "string"
                },
                "failureDescription": {
                    "description": "Details of the action failure.",
                    "type": "string"
                },
                "failureAction": {
                    "description": "Action to be taken to resolve the failure",
                    "type": "string"
                },
                "failureMessageCode": {
                    "description": "Message ID associated with the event.",
                    "type": "string"
                }
            },
            "required": ["reference", "title", "details", "state"]
        }
    },
    "type": "object",
    "title": "Action",
    "allOf": [{ "$ref": "GeneralSplunkHeader.json#" }],
    "properties": {
        "event": {
            "type": "object",
            "allOf": [{ "$ref": "#/definitions/ActionEvent" }, { "$ref": "GeneralSplunkEvent.json#" }]
        }
    }
}
Alert.json
{
    "$schema": "http://json-schema.org/draft-04/schema#",
    "definitions": {
        "AlertEvent": {
            "type": "object",
            "properties": {
                "reference": {
                    "description": "The object reference of the alert.",
                    "type": "string"
                },
                "title": {
                    "description": "Title of the event which triggered the alert.",
                    "type": "string"
                },
                "code": {
                    "description": "Dotted descriptor of the type of event which triggered the alert.",
                    "type": "string"
                },
                "eventSeverity": {
                    "description": "The severity of the event.",
                    "type": "string"
                },
                "details": {
                    "description": "Plain text description of the event which triggered the alert.",
                    "type": "string"
                },
                "response": {
                    "description": "Automated response, if any, taken by the system.",
                    "type": "string"
                },
                "timestamp": {
                    "description": "The time the alert occurred.",
                    "type": "string"
                },
                "target": {
                    "description": "Reference to the target object.",
                    "type": "string"
                },
                "targetName": {
                    "description": "Name of the target object.",
                    "type": "string"
                }
            },
            "required": ["reference", "title", "code", "details", "timestamp"]
        }
    },

    "type": "object",
    "title": "Alert",
    "allOf": [{ "$ref": "GeneralSplunkHeader.json#" }],
    "properties": {
        "event": {
            "type": "object",
            "allOf": [{ "$ref": "#/definitions/AlertEvent" }, { "$ref": "GeneralSplunkEvent.json#" }]
        }
    }
}
JobEvent.json
{
    "$schema": "http://json-schema.org/draft-04/schema#",
    "definitions": {
        "JobEvent": {
            "type": "object",
            "properties": {
                "job": {
                    "description": "The object reference of job associated with this event.",
                    "type": "string"
                },
                "parentAction": {
                    "description": "The object reference of the parent action of the associated job.",
                    "type": "string"
                },
                "jobState": {
                    "description": "The new state of the job.",
                    "type": "string"
                },
                "timestamp": {
                    "description": "The time the event occurred.",
                    "type": "string"
                },
                "percentComplete": {
                    "description": "Completion percentage of the job associated with this event",
                    "type": "number"
                },
                "diagnoses": {
                    "description": "If job failed, a set of diagnoses of things that may have caused the failure.",
                    "type": "array",
                    "items": { "$ref": "#/definitions/DiagnosisResult" }
                },
                "eventType": {
                    "description": "The type of this event (info, warning, or error).",
                    "type": "string"
                },
                "messageCode": {
                    "description": "A message code describing this event.",
                    "type": "string"
                },
                "messageDetails": {
                    "description": "A message describing the details of this event.",
                    "type": "string"
                },
                "messageAction": {
                    "description": "Action to be taken by the user to repair or remedy the situation.",
                    "type": "string"
                },
                "messageCommandOutput": {
                    "description": "Any command output generated by this event",
                    "type": "string"
                }
            },
            "required": ["job", "parentAction", "timestamp", "percentComplete", "messageCode", "messageDetails", "eventType"]
        },
        "DiagnosisResult": {
            "type": "object",
            "properties": {
                "diagnosisCode": {
                    "description": "Message code associated with this diagnosis check.",
                    "type": "string"
                },
                "diagnosisMessage": {
                    "description": "Description of this diagnosis check.",
                    "type": "string"
                },
                "failed": {
                    "description": "True if this diagnosis check did not pass.",
                    "type": "boolean"
                },
                "targetReference": {
                    "description": "Reference of the target object of this diagnosis check, if applicable.",
                    "type": "string"
                }
            },
            "required": ["diagnosisCode", "diagnosisMessage", "failed"]
        }
    },
    "type": "object",
    "title": "JobEvent",
    "allOf": [{ "$ref": "GeneralSplunkHeader.json#" }],
    "properties": {
        "event": {
            "type": "object",
            "allOf": [{ "$ref": "#/definitions/JobEvent" }, { "$ref": "GeneralSplunkEvent.json#" }]
        }
    }
}
AbstractFault.json
{
    "$schema": "http://json-schema.org/draft-04/schema#",
    "type": "object",
    "title": "AbstractFault",
    "properties": {
        "reference": {
            "description": "The object reference of the fault.",
            "type": "string"
        },
        "title": {
            "description": "Title of the event which triggered the fault.",
            "type": "string"
        },
        "code": {
            "description": "Dotted descriptor of the type of event which triggered the fault.",
            "type": "string"
        },
        "details": {
            "description": "Plain text description of the event which triggered the fault.",
            "type": "string"
        },
        "response": {
            "description": "Automated response, if any, taken by the system.",
            "type": "string"
        },
        "dateDiagnosed": {
            "description": "The date when the fault was diagnosed.",
            "type": "string"
        },
        "target": {
            "description": "Reference to the target object.",
            "type": "string"
        },
        "targetName": {
            "description": "Name of the target object.",
            "type": "string"
        },
        "state": {
            "description": "The state of the fault."
        },
        "eventSeverity": {
            "description": "The severity of the event.",
            "type": "string"
        }
    },

    "required": ["reference", "title", "details", "state", "target", "dateDiagnosed"]
}
Fault.json
{
    "$schema": "http://json-schema.org/draft-04/schema#",
    "definitions": {
        "FaultEvent": {
            "type": "object",
            "properties": {
                "dateResolved": {
                    "description": "The date when the fault was resolved.",
                    "type": "string"
                },
                "resolutionComments": {
                    "description": "Comments regarding the resolution of the fault.",
                    "type": "string"
                }
            }
        }
    },

    "type": "object",
    "title": "Fault",
    "allOf": [{ "$ref": "GeneralSplunkHeader.json#" }],
    "properties": {
        "event": {
            "type": "object",
            "allOf": [{ "$ref": "AbstractFault.json#" }, { "$ref": "#/definitions/FaultEvent" }, { "$ref": "GeneralSplunkEvent.json#" }]
        }
    }
}
FaultEffect.json
{
    "$schema": "http://json-schema.org/draft-04/schema#",
    "definitions": {
        "AlertEvent": {
            "type": "object",
            "properties": {
                "reference": {
                    "description": "The object reference of the alert.",
                    "type": "string"
                },
                "title": {
                    "description": "Title of the event which triggered the alert.",
                    "type": "string"
                },
                "code": {
                    "description": "Dotted descriptor of the type of event which triggered the alert.",
                    "type": "string"
                },
                "eventSeverity": {
                    "description": "The severity of the event.",
                    "type": "string"
                },
                "details": {
                    "description": "Plain text description of the event which triggered the alert.",
                    "type": "string"
                },
                "response": {
                    "description": "Automated response, if any, taken by the system.",
                    "type": "string"
                },
                "timestamp": {
                    "description": "The time the alert occurred.",
                    "type": "string"
                },
                "target": {
                    "description": "Reference to the target object.",
                    "type": "string"
                },
                "targetName": {
                    "description": "Name of the target object.",
                    "type": "string"
                }
            },
            "required": ["reference", "title", "code", "details", "timestamp"]
        }
    },

    "type": "object",
    "title": "Alert",
    "allOf": [{ "$ref": "GeneralSplunkHeader.json#" }],
    "properties": {
        "event": {
            "type": "object",
            "allOf": [{ "$ref": "#/definitions/AlertEvent" }, { "$ref": "GeneralSplunkEvent.json#" }]
        }
    }
}
Types of events
Delphix uses the source field in Splunk to designate the type of each event. Here is a full list of the possible values of the source field for events, along with an explanation of when each event is generated and the name of the corresponding JSON schema that describes the event structure.
|
source |
Explanation |
Schema |
|---|---|---|
|
delphix.events.action.started |
Action has started running. |
Action.json |
|
delphix.events.action.waiting |
Action has moved to the WAITING state. |
Action.json |
|
delphix.events.action.completed |
Action has completed successfully. |
Action.json |
|
delphix.events.action.failed |
Action has failed. |
Action.json |
|
delphix.events.action.canceled |
Action has been canceled. |
Action.json |
|
delphix.events.job.event |
Job Event has been generated in response to a Job progress update. |
JobEvent.json |
|
delphix.events.fault.posted |
Fault has been posted. |
Fault.json |
|
delphix.events.fault.resolved |
Fault has been resolved. |
Fault.json |
|
delphix.events.fault.ignored |
User has chosen to ignore a fault. |
Fault.json |
|
delphix.events.fault.unignored |
User has chosen to “unignore” a previously ignored fault. |
Fault.json |
|
delphix.events.fault.effect.posted |
Fault Effect has been posted as a downstream effect of some Fault. |
FaultEffect.json |
|
delphix.events.fault.effect.resolved |
Fault Effect has been resolved as a result of its cause being resolved. |
FaultEffect.json |
|
delphix.events.fault.effect.ignored |
Fault Effect has been ignored when a user chose to ignore its cause. |
FaultEffect.json |
|
delphix.events.fault.effect.unignored |
Fault Effect has been “unignored” when a user chose to unignore its previously ignored cause. |
FaultEffect.json |
|
delphix.events.alert |
Alert has been posted. |
Alert.json |
Search examples - metric formats
JSON schemas for metrics
GeneralMetricEvent.json
{
   "$schema": "http://json-schema.org/draft-04/schema#",
   "type": "object",
   "properties": {
       "systemUniqueId": {
           "description": "The UUID of the system.",
           "type": "string"
       },
       "systemVersion": {
           "description": "The release version of the system.",
           "type": "string"
       },
       "event": {
          "description": "A tag that indicates this Event is a metric.",
          "type": "string",
          "enum": ["metric"]
       }
   },
   "required": ["systemUniqueId", "systemVersion", "event"]
}
A schema that is common for all metrics, the “data” nested JSON object contents varies depending on the metric:
CommonMetric.json
{
   "$schema": "http://json-schema.org/draft-04/schema#",
   "definitions": {
       "CommonMetric": {
           "type": "object",
           "properties": {
               "name": {
                   "description": "The name of the metric.",
                   "type": "string"
               },
               "time": {
                   "description": "The timestamp of the metric when it was collected. The default time format is epoch time format, in the format <sec>.<ms>.",
                   "type": "number"
               },
               "value": {
                   "description": "The numeric value of the metric.",
                   "type": "number"
               },
               "type": {
                   "description": "The type of measurement.",
                   "type": "string",
                   "enum": ["counter", "g", "value", "summary"]
               },
               "data": {
                   "description": "JSON object having further details on the metric. Contents depends on the actual metric.",
                   "type": "object"
               }
           }
       }
   },

   "type": "object",
   "title": "CommonMetric",
   "allOf": [{ "$ref": "GeneralSplunkHeader.json#" }],
   "properties": {
       "event": {
           "type": "object",
           "allOf": [{ "$ref": "#/definitions/CommonMetric" }, { "$ref": "GeneralMetricEvent.json#" }]
       }
   }
}
Metrics format
Metrics Format is the combination of the two tables below (metadata + metric specific key-values).
|
JSON key |
Value type |
Description |
Example |
Comments |
|---|---|---|---|---|
|
source |
String |
Dotted name hierarchy for insight source. |
delphix.metrics.xyz
|
This is the “source” value assigned to an event data in Splunk. |
|
index |
String |
Splunk metrics index name |
insight_metrics |
Splunk Index name |
|
host |
String |
Hostname/IP |
pks-insight.dc2.delphix.com
|
Could also serve as a tag in other time-series data (like opentsdb) |
|
event |
"metric" |
Describes what kind of event this is. |
n/a |
Signifies this Splunk event is a “Metric”. |
|
sourcetype |
“_json” |
Data format |
n/a |
Used for Splunk Indexed field extractions |
|
systemUniqueId |
String |
The UUID of the system |
"423f22db-4ee9-6ebe-ff0f-884ffdc351f7" |
|
|
systemVersion |
String |
The release version of the system |
5.2.5.0 |
|
And the general key-values specific to an Insight metric are:
|
JSON key |
Value type |
Description |
Example |
Comments |
|---|---|---|---|---|
|
name |
String |
Pseudo hierarchical dotted format of the metric name. |
system.cpu.util.pct system.disk.ops.count system.net.total.bytes |
A metric name:
prefix that points to the source of the data (like system.cpu)
suffix that describes the unit (when it can)
total as part of suffix for example. |
|
time |
UNIX time notation (epoch) |
Timestamp |
1525399950 |
UNIX epoch time format. |
|
value |
Numeric value of the metric |
The actual measurement |
85.17 (system.cpu.util.pct) |
Numeric only |
|
type |
String (Enum):
|
Type of the measurement |
counter | gauge | summary |
This field could be used to identify what kind of value a metric is presenting (like a “gauge” for cpu metric implies the values will fall into a range of 0-100% - similarly a “summary” would imply the value is an “accumulated value” like network utilization ) |
|
data |
JSON Object |
Dimensions of the metric (if any). |
{ "read_latency": 0.98, "ops_write": 20, "ops_read": 30, "write_latency": 0.55, } |
Has additional info about a metric (called “Dimensions” in Splunk) Has different key-vals depending on a given metric Like for CPU: it can have key-vals to like “kernel”, “user” For disk: can have latency/throughput, operation name |
Summary of all the current metrics
|
Metric name |
Metric value |
Metric dimensions (data.xxx below) |
|---|---|---|
|
system.cpu.util.pct |
cpu utilization percentage aggregated across all cpus |
user, kernel, idle |
|
system.disk.ops.count |
disk read/write operations aggregated across all disk instances |
count, op (read/write), latency, avgLatency, throughput |
|
system.net.total.bytes |
network utilization - total bytes (in + out) of a given network interface |
networkInterface, inBytes, outBytes, inPackets, outPackets |
|
system.nfs.ops.count |
nfs read/write operations aggregated across all instances |
count, op (read/write), latency, avgLatency, throughput |
|
system.iscsi.ops.count |
iscsi read/write operations aggregated across all instances |
count, op (read/write), latency, avgLatency, throughput |
|
system.tcp.total.bytes |
tcp connection statistics aggregated by service (nfs/iscsi/dsp etc) |
congestionWindowSize, inBytes, inUnorderedBytes, localAddress, outBytes, receiveWindowSize, remoteAddress, retransmittedBytes, roundTripTime, sendWindowSize, service unacknowledgedBytes, unsentBytes |
|
system.dataset.total.bytes |
dataset performance - total number of bytes read + written per dataset (dsource/vdb etc) |
dataset, nread, nwritten, type (virtual, dsource, staging) |
|
system.capacity.source.size |
overall system capacity - actual used space in bytes |
actualSpace, totalSpace, activeSpace, actualSpace, descendantSpace, logSpace, manualSpace, policySpace, syncSpace, timeflowUnvirtualizedSpace, unownedSnapshotSpace, unvirtualizedSpace |
|
system.capacity.consumer.size |
consumer capacity - actual used space in bytes per consumer (vdb/pdb etc) |
syncSpace, descendantSpace, activeSpace, timeflowUnvirtualizedSpace, objectType, dSource, actualSpace, groupName, manualSpace, unownedSnapshotSpace, unvirtualizedSpace, logSpace, policySpace, consumerName |