
Accessing the dataset performance graph
-
Log into the Delphix Management application.
-
In the Resources menu, select Dataset Performance.
-
Use the controls described below to view statistics and their related graphs.
General graph display and controls
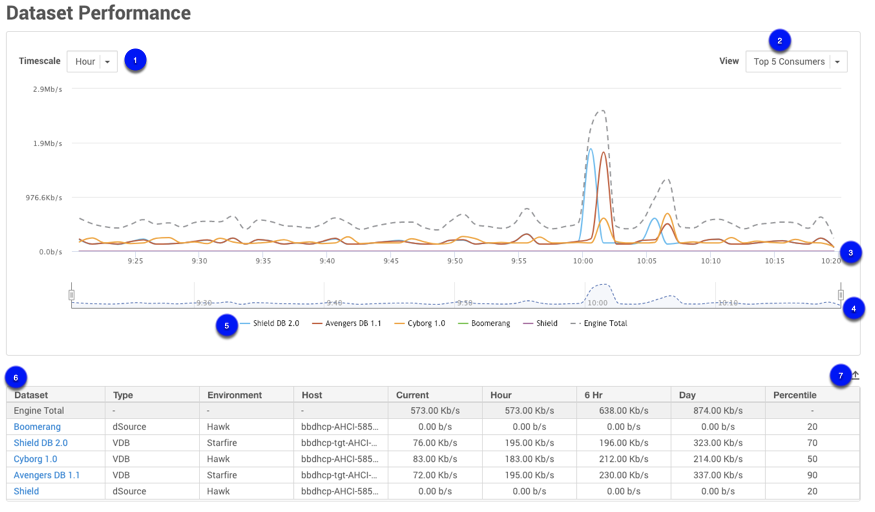

Timescale: Select from hour, 6 hours, day

View: View data by top 5 consumers or by the 75% percentile

Dateline: Displays timestamps of data points in the graph.

Timeline selector: Specifies the start and end time for the currently displayed data. The range displayed is controlled by selecting the slider. Drag the slider to view statistics for the specific time.

Graph legend: If more than one set of information is presented on the graph, Graph Legend displays a description and color for each set.

Dataset table: Displays the information for each Dataset in a table format. Selecting a Dataset link takes you to the Dataset Status page.

Export: Exports the displayed table data.