Block storage cache reports
Block storage cache reports, accessed via the Setup dashboard or system CLI, can determine if configured block cache capacity is at the optimal size. IO statistics are collected for up to twice the current size for the block cache. For example, if the total block cache size is 100GB, the Delphix Elastic Data engine collects statistics and displays the predicted performance assuming 200GB of block cache. This information contained in block storage cache reports can help predict if a higher cache hit rate can be achieved with a smaller or larger block cache size.
Block storage access graph
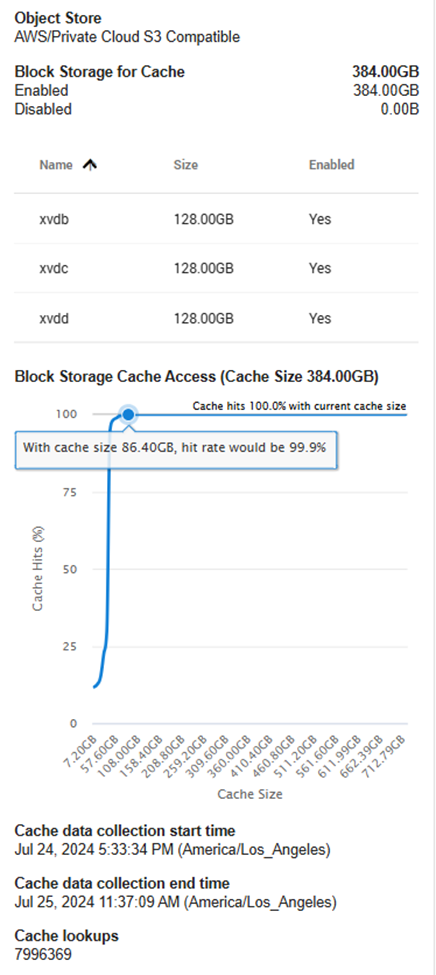
In the Setup Dashboard, the block storage cache access graph displayed in the Storage panel can determine if the configured block cache capacity is at the optimal size.
The example graph below illustrates that if the block cache size was reduced from 384GB to 86.40GB, it would not affect performance, but it would, however, lower storage costs.

The block storage cache access graph also provides the following information:
Cache data collection start time - records the exact time when the cache collection was started. The start time is displayed in the user’s time zone.
Cache data collection end time - records the exact time the cache stops collecting data. Typically, cache collection ends when the page refreshes. The end time is displayed in the user’s time zone.
Cache lookups - records the number of attempts to find data in the cache.
Accessing a block cache report from the CLI
The block cache hits report can be accessed via the sysadmin CLI.
Run this command to access a cache report:
# storage objectStorage cacheHitsReport *> get
json: (unset)
# storage objectStorage cacheHitsReport *> commit
The example hit report below illustrates that if the block cache size was reduced from 360GB to 90GB, it would not affect performance, but it would, however, lower storage costs.
Example block cache hits report |
|---|
Data collection started: Wed, 24 Jul 2024 17:33:34 -0700 Data collection ended: Thu, 25 Jul 2024 11:52:43 -0700 (18h 19m 8s) Cache Hits: 100.0% in 360GB cache (8047497 lookups with 8047495 hits) size : hit% 0 20 40 60 80 100 ------------------------------------------------------------------------------ 45.0GB : 95.5% ********************************************************** | 90.0GB : 99.9% ***********************************************************| 135GB : 100.0% ***********************************************************| 180GB : 100.0% ***********************************************************| 225GB : 100.0% ***********************************************************| 270GB : 100.0% ***********************************************************| 315GB : 100.0% ***********************************************************| 360GB : 100.0% ***********************************************************| |
To clear the block cache hit stats, run this command:
# storage objectStorage> clearCacheHits
# storage objectStorage clearCacheHits *> commit