
This topic describes the Performance Analytics tool and illustrates some basic uses of it.
Introduction
The performance analytics tool allows introspection into how the Delphix Engine is performing. The introspection techniques it provides are tuned to allow an iterative investigation process, helping to narrow down the cause associated with the performance being measured. Performance analytics information can be accessed through the Delphix Management application, as described in Working with Performance Analytics Graphs in the Graphical User Interface, as well as the CLI and the web services API, as described in other topics in this section. The default statistics that are being collected on the Delphix Engine include CPU utilization, network utilization, and disk, NFS, and iSCSI IO operations (see Performance Analytics Statistics Reference for details).
The performance tool operates with two central concepts: statistics and statistic slices.
Statistics
Each statistic describes some data that can be collected from the Delphix Engine. The first piece of information a statistic provides is its type, which you will use as a handle when creating a statistic slice. It also gives the minimum collection interval, which puts an upper bound on the frequency of data collection. The actual data a statistic can collect is described through a set of axes, each of which describes one "dimension" of that statistic. For example, the statistic associated with Network File System (NFS) operations has a latency axis, as well as an operation type axis (among many others), which allows users to see NFS latencies split by whether they were reads or writes.
Each axis has some important information embedded in it.
-
The name of the axis provides a short description of what the axis collects and is used when creating a statistic slice
-
A value type, which tells you what kind of data will be collected for this axis. The different value types are integer, boolean, string, and histogram. The first three are straightforward, but statistic axes with a histogram type can collect a distribution of all the values encountered during each collection interval. This means that instead of seeing an average NFS operation latency every collection interval, you can see a full distribution of operation latencies during that interval. This allows you to see outliers as well as the average, and observe the effects of caching on the performance of your system more easily.
-
A constraint type, which is only relevant while creating a statistic slice, and will be described in more detail below
One last bit of information that an axis provides makes the most sense after seeing how data points are queried. In the most basic situation, you would only collect one axis of a statistic, such as the latency axis from the NFS operations statistic. When you ask for data, you would get back a data point for every collection interval in the time range you requested. These data points would be grouped into a single stream.
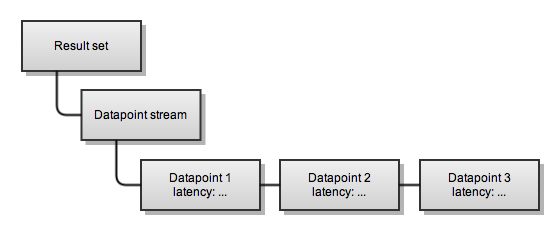
However, if you had collected the operation type axis as well as the latency axis, you would get two streams of datapoints: one for reading operations, and one for write operations.

Because the operation axis applies to many data points, the data points returned are split into two streams, and the operation axis is stored with the top-level stream instead of with each data point in the streams. However, the latency axis will be different for each data point in a stream, so it is not an attribute of the stream, but instead an attribute of the datapoint.
Statistic slices
Statistics describe what data can be collected and are auto-populated by the system, but statistic slices are responsible for actually collecting the data, and you must create them manually when you want to collect some performance data. Each slice is an instantiation of exactly one statistic, and can only gather data that is described by that statistic. "Slices" are so named because each one provides a subset of the information available from the parent statistic it is associated with. A statistic can be thought of as describing the axes of a multidimensional space, whereas you typically will only want to collect a simpler slice of that space due to the large number of axes available.
When you specify a slice, there are several fields that you must supply:
-
The statistic type this slice is associated with. This must be the same type as the statistic of which this is an instantiation.
-
The collection interval, which must be greater than the minimum collection interval the parent statistic gives
-
The axes of the parent statistic this slice will collect
Finally, a slice can place constraints on axes of its parent statistic, allowing you to limit the data you get back. For instance, if you're trying to narrow down the cause of some high NFS latency outliers, it may be useful to filter out any NFS latencies which are shorter than one second. To do this, you would place a constraint on the latency axis of an NFS operation slice that states that the values must be higher than one second. You can constrain any axis in the same fashion, and each axis' description in the parent statistic gives a constraint type that can be applied to it. This allows you to place different types of constraints on the latency axis (which is a number measured in nanoseconds) than the operation type axis (which is an enum that can take the values "read" or "write").
Persisting analytics data
Data collected by slices is persisted temporarily on the Delphix Engine. Performance data is guaranteed to be available at the finest resolution for six hours, then is compressed to per-minute data and held for seven days, and finally compressed to per-hour data and held for 30 days. If data of a certain resolution will be needed longer than these limits, you should instruct the slice to remember the data permanently until you are done using it. The commands to manage this are listed in the Performance Analytics Tool API Reference.